“ ”
We wanted to ensure that we created a system that could satisfy all of these things, but above everything, did not get in the way of staff and student dialogue about what skills and knowledge they demonstrated and what areas they need to review.
In fact, the removal of levels gave us a great opportunity to develop ‘Assessment Experts’ who had the time and space to have those learning conversations with students.
We decided that developing our teachers’ expertise in assessment was more important than trying to invent levels by another name. The concern was how we would know if the students were making the same amount of progress as their peers nationally – but we later found that GL Assessment would fill this gap for us.
We used the idea of reporting all assessments at KS3 numerically, as a simple percentage, based purely on how much of the criteria being used to make the assessment has been demonstrated by the student. This freedom (eventually) allowed accurate, valid, reliable and efficient assessments to be created by staff, and importantly, for different class groups with different curriculum experiences. It allowed us to give detailed guidance of how students were achieving compared to their peers within school, and some guidance to parents about how students were achieving compared to the new GCSE specifications.
The national context
The next step was ensuring that our students were indeed making the same progress as their peers on a national scale. Without having an overarching cross school curriculum (the national curriculum isn’t time based so different schools obviously vary their curriculum maps) how could we compare our students to that of national peers? This is where GL Assessment came in.
By using the Progress Test Series (which covers English, maths and science), we can now tell that, in maths, our Year 7 students matched their peers nationally with the exact same standardised score. In terms of attainment, I can tell you that on average they are better at certain mathematical skills than the national average but are slightly less successful at others. We can also say that they have made (on average) more progress than the national average in their fluency in conceptual understanding, and the processes they use, but we can also see that we need to work as a year group at their ability to problem solve.
In Year 8 we now know that our students demonstrate skills and knowledge above that of their national peers in certain mathematical skills again, but also they now have caught up in terms of probability (a key curriculum focus in Year 8).
We know that reading comprehension is above average in Year 7 (compared to national) but most year groups need to further develop their grammar and punctuation skills. By Year 9, we can see that in English disadvantaged students have matched the national average for all students in terms of average overall score.
As a school we are very confident that our maths and English teams already know what skills and knowledge students need to develop. However, in a world beyond levels and new 9-1 GCSEs, by benchmarking our students’ attainment and progress against others nationally using standardised tests from GL Assessment, we were able to validate that confidence, and support teams and teachers in developing themselves as assessment experts that impact on learning, rather than creating ever more complicated ways to reinvent levels.

“ ”
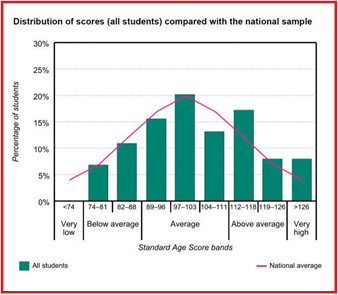
Figure 1
Eight reasons why we use the Progress Test Series
1. To compare our cohort to the national context
In figure 1, we can see that students have demonstrated skills and knowledge broadly in line with national averages. It shows us that this is broadly national in attainment – a vital step to ensuring that attainment can be measured on the new GCSE 9-1 before the exam is taken.
We can also see that we have a few more higher achieving students than national on average, which leads to good questions about the stretch and challenge found in KS3 and how these groups of students are supported going forward.
2. To compare a cohort’s skills and knowledge (demonstrated) to those same skills nationally
If only 14% of students correctly answered the problem solving questions on this paper but nationally only 13% achieved the same result, it means that while there is clearly a skills gap between what we want students to be able to do, there is very little gap between these students and students nationally. This is a very important distinction.
Being able to examine the abilities of a cohort skill by skill compared to the national picture is incredibly useful and can lead to powerful evidence-based conversations at all school leadership levels
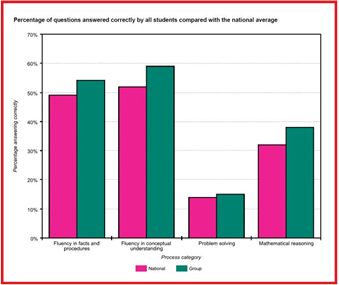
Figure 2
“ ”
3. To compare a cohort’s attainment question by question to the national average
Every school has a different curriculum map, and as such, a national assessment comparison may indicate students demonstrating knowledge and skills extremely well as those skills have been deeply embedded that term. It’s therefore always good to examine the assessment alongside your cohort’s curriculum and highlight questions that assess the skills and knowledge that are closely aligned to the cohort’s curriculum experience.
GL Assessment’s reports then allow you to look at each question compared to national attainment averages. Again, this leads to very powerful conversations with teachers.
4. To measure overall progress by year, by group, by class, benchmarked to the national average
Using data from the Progress Test Series, we can judge the percentage of Year 9 students that made at least expected progress in English within the year when compared to the national average, as well as the number that achieved the same standardised score. We can see the groups, classes and students who made much greater than expected progress within the school year as well as those that matched their peers nationally in attainment.
“ ”

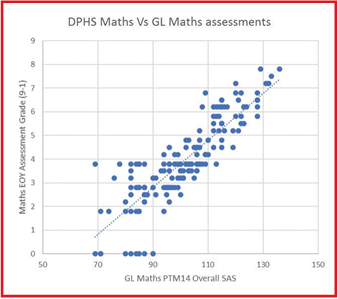
Figure 3
5. To validate that internal assessments were telling us the correct information
Assessment is best when its designer (the teacher, when we’re talking about internal assessments) is free to create an assessment that is valid, reliable and efficient based solely on the curricula that has been taught (or is expected to have been experienced by the students). Too often if you try to link that assessment or its outcome to something else to give it a different purpose it loses its validity (including questions that cover material that hasn’t been taught but another class has experienced as an example).
To that end, our assessments are only reported back to the school as a percentage. The formative feedback in the classroom is key to students moving forward, and that’s what the best assessments focus on. We then create the holistic view of the team and the student by a simple three times a year conversion of the percentages to a GCSE grade level.
At all times the students see only the formative feedback and a percentage (where needed). This allows great freedom for staff to plan and assess professionally, without concerns about students’ progress term by term.
However, as a school, we must ensure that our assessment “system” is giving us the right “picture” of a student’s progress in their school life. This is where we used the GL Assessment data. You can see here one assessment of the year group that correlates very clearly with the GL Assessment data, giving us confidence that our internal assessments are correctly assessing students’ strengths and areas for development.
6. To demonstrate progress at KS3 to visitors
With Ofsted’s clear message that in-year data is key, it’s useful to be able to demonstrate the progress and attainment of students in all year groups, and groups within year groups.
For example if we are asked to explain how many students in Years 7, 8 and 9 are making at least expected progress, we are able to do this very easily by using our internal assessments (mapped at the end of year to GCSE grades), which are validated in English, maths and science by the correlation to the Progress Test Series. In addition, we could use the reports from GL Assessment to demonstrate the progress students had made in-year.
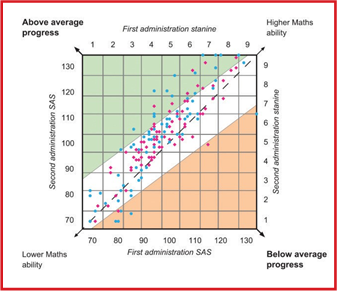
Figure 4
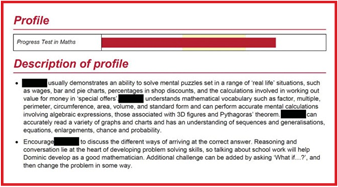
Figure 5
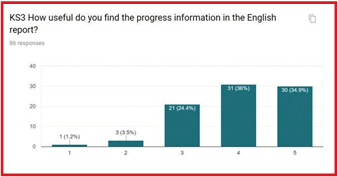
Figure 6
7. To provide parents with individual feedback
GL Assessment provides an individualised student report for every assessment within the Progress Test Series, based on attainment, and when a previous test has been taken, progress. We email the individual parent reports to parents at the end of each year to give them more ideas about how they can support their child with work at home.
We found that parents have responded very well to these reports on the whole, and work well as a supplement to the feedback that we give students normally, as can been in the survey we carried out at the end of last year: On a scale of 1 (not useful at all) to 5 (Extremely Useful):
8. To impact on learning
Finally, and most importantly, GL Assessment data is being used to impact teaching directly. Here are some direct examples from teachers on how they are going to use the data this term:
- “To set individual homework based on the skills gaps from the end of year assessment”
- "Check-up during progress week on which skills were highlighted – have they have now developed?”
- "Introducing SPAG connect activities each lesson to build spelling and grammar skills”
- "Meta-cognitive reading strategies to stretch the higher ability in comprehension techniques”
- "Seating plans based on skills gaps, to buddy up”
- "Spaced testing to deal with some skills not yet fully understood”
- "Questioning in lessons based on gaps from assessments"
- "More deeper learning/problem solving tasks put into Year 7, 8 and 9 curriculum”
- "Problem-solving questions as starters in Year 7”
- "Progress Boards (not just high attainers) to champion progress in year across the team”
“ ”

“ ”
In summary
With the help of GL Assessment’s national standardised data, we have been able to develop Assessment Experts who are free to assess in the way that works best for students, while providing evidence of students’ success to parents, leaders, governors and school visitors.
Oh, and did I mention all without impacting on teachers’ time? GL Assessment marks and standardises it all for you, leaving more time for the conversation. The conversation between teachers, the conversation between teachers and students and the conversation between parents and teachers - it’s those conversations that lead to learning.


